Global Desalination System Market Size, Share, and Growth & Trends Analysis By Desalination Method (Thermal Desalination Processes, Membrane Desalination Processes, Ion Exchange, Others) By Application (Municipalities, Island Hotels And Resorts, Industries, Emergency Drinking Water Systems, Off-Shore Platforms, Others) By Region (North America, Asia Pacific, Europe, Middle East & Africa, South America): Regional Outlook, Growth Potential and Segments Forecast 2024-2031

Loading...

Budget constraints? Get in touch with us for special pricing

Buying Options

Original price was: $9,999.00.Current price is: $8,999.00.
Original price was: $4,999.00.Current price is: $3,999.00.
Original price was: $3,999.00.Current price is: $2,999.00.
Loading...

Description

The Global Desalination System Market size was USD $ 15.3 billion in 2023 and is projected to reach USD $ 32.5 billion by 2031, with a CAGR of 9.4 % during the forecast period.  

Global Desalination System Market: Overview

The desalination system market is experiencing notable innovations and trends that are reshaping water treatment globally. Key advancements include enhanced efficiency driven by innovations in reverse osmosis and multi-effect distillation technologies, which increase freshwater yields per unit of energy consumed. For example, Dow Water & Process Solutions has developed high-performance reverse osmosis membranes that can achieve up to 99.8% salt rejection while reducing energy consumption. Integration of renewable energy sources such as solar and wind is reducing environmental impact and improving the economic viability of desalination plants. Abengoa, a Spanish renewable energy company, has built several large-scale solar-powered desalination plants in the Middle East and North Africa. Forward osmosis is also emerging as a promising technology due to its lower energy requirements and reduced environmental footprint, with companies like Oasys Water and Aquaporin developing forward osmosis-based desalination systems.

Membrane technology innovations, such as graphene-based membranes from researchers at the University of Manchester, are boosting desalination performance by enhancing salt rejection and minimizing fouling. There’s a growing shift towards decentralized systems, providing water solutions to rural and disaster-stricken areas, as seen in Watergen’s atmospheric water generators that can produce drinking water from air. Hybrid desalination processes combining various technologies, like the integration of reverse osmosis and membrane distillation by Suez, are improving efficiency and lowering costs. Smart monitoring and data analytics through IoT devices, as implemented by companies like Aquatech International, are optimizing plant operations in real-time, reducing energy consumption and maintenance costs.

Global Desalination System Market: Covid-19 Impact

The COVID-19 pandemic has impacted the desalination system market, with both challenges and opportunities emerging. Supply chain disruptions affected production and distribution, while increased sanitation needs boosted demand for clean water solutions. Innovations in membrane technology and remote monitoring have gained traction. Market players are adapting with enhanced safety protocols and digital solutions. The long-term outlook includes growth in healthcare facility installations and resilience planning against future disruptions.

Global Desalination System Market: Growth Drivers

  • Increasing Water Scarcity:

As freshwater sources dwindle globally due to population growth and climate change, desalination offers a reliable alternative to meet growing water demand.

  • Technological Advancements:

Continuous innovations in desalination technologies, such as membrane enhancements and energy-efficient processes, drive efficiency and reduce operational costs.

  • Government Initiatives:

Governments worldwide are investing in desalination projects to secure water supply, especially in arid regions, fostering market growth and infrastructure development.

Global Desalination System Market: Restraining Factors

  • High Initial Costs:

The capital-intensive nature of desalination plants poses a significant barrier, limiting widespread adoption in regions with constrained financial resources.

  • Environmental Concerns:

Disposal of brine and energy consumption in desalination processes can impact marine ecosystems and carbon footprints, necessitating stringent environmental regulations and higher operational costs.

Global Desalination System Market:  Opportunity Factors

  • Emerging Markets:

Untapped markets in developing countries present opportunities for desalination system providers to expand their global footprint.

  • Integration with Renewable Energy:

Increasing integration of desalination with renewable energy sources like solar and wind power offers sustainable solutions, reducing reliance on fossil fuels and enhancing market prospects.

Global Desalination System Market: Challenges

  • Energy Intensity:

Desalination processes are energy-intensive, posing challenges in achieving cost-effective and sustainable operations.

  • Technological Hurdles:

Addressing issues related to membrane fouling, scaling, and maintenance is crucial to improving efficiency and reducing operational complexities in desalination plants.

Global Desalination System Market: Segmentation

Based on Desalination Method: The market is segmented into Thermal Desalination Processes, Membrane Desalination Processes, Ion Exchange, Others.

Based on Application: The market is segmented into Municipalities, Island Hotels and Resorts, Industries, Emergency Drinking Water Systems, Off-Shore Platforms, Others.

Global Desalination System Market: Regional Insights

  • North America:

The desalination system market in North America is experiencing growth driven by increasing water scarcity and the need for reliable freshwater sources. Technological advancements in reverse osmosis and membrane technologies have enhanced efficiency and reduced costs, making desalination more feasible. For instance, Dow Water & Process Solutions has developed high-performance reverse osmosis membranes that can achieve up to 99.8% salt rejection while reducing energy consumption by 35%. Government initiatives and investments in sustainable water management further propel market expansion, such as the U.S. Bureau of Reclamation’s WaterSMART program, which provides funding for desalination and water reuse projects.

Key players are focusing on developing innovative solutions to address environmental concerns and energy efficiency, crucial for market competitiveness. Aquatech International has launched its ZLD (Zero Liquid Discharge) desalination technology, which minimizes waste and maximizes water recovery, while Desalitech has introduced its Closed-Circuit Desalination (CCD) systems that reduce energy consumption by up to 35%. North America’s desalination market is characterized by a mix of large-scale industrial projects, like the 50 MGD desalination plant in Carlsbad, California, and smaller, localized systems catering to diverse needs across sectors like municipal, industrial, and agricultural.

Challenges such as high initial costs and environmental impacts continue to shape market dynamics, driving efforts towards improving sustainability and affordability in desalination technologies. As demand for freshwater rises amid climate change impacts, the North American desalination system market is poised for continued growth and technological evolution, with a focus on developing cost-effective, energy-efficient, and environmentally friendly solutions.

  • Asia Pacific:

The Asia Pacific desalination system market is experiencing significant growth driven by increasing water scarcity and rapid urbanization across the region. Desalination technologies are becoming crucial in addressing freshwater shortages, particularly in arid and coastal areas. Countries like China, Australia, and India are investing heavily in desalination plants to meet their growing water demands for industrial, municipal, and agricultural purposes. Technological advancements, such as improved energy efficiency and cost-effectiveness of desalination processes, are further boosting market adoption. However, challenges remain, including high initial investment costs, environmental concerns related to brine disposal, and energy consumption. Despite these challenges, the Asia Pacific desalination system market is poised for expansion as governments and industries prioritize sustainable water management solutions to mitigate the impact of water scarcity on economic growth and public health.

Global Desalination System Market: Competitive Landscape

Veolia Environment, Kurita Water Industries Ltd, Toyobo Co., Ltd, Koch Industries, Inc, Vontron Membrane Technology Co Ltd, The Dow Chemical Company, Toray Industries, Inc., Nitto Denko Corporation, Ge Corporation, DuPont.

Global Desalination System Market: Recent Developments

  • April 2024- Kurita Water Industries Ltd. began to launch Sensing WEB 2.0 (hereinafter the “Latest Version”), that is the Kurita Group’s unique cloud-based service for remote monitoring of water treatment at customers’ plants and other sites, sequentially in April, 2024. 
  • Veolia is launching an urgent appeal to speed up the implementation of solutions that will safeguard water resources, and protect them for tomorrow’s world.
  • May 2024- Toyobo Co., Ltd. is pleased to announce that its TOYOBO GS Catalyst, an eco-friendly aluminium catalyst for polyester polymerization that is free of heavy metals, has been recognized as meeting or exceeding the voluntary requirements for APR Design for Recyclability.

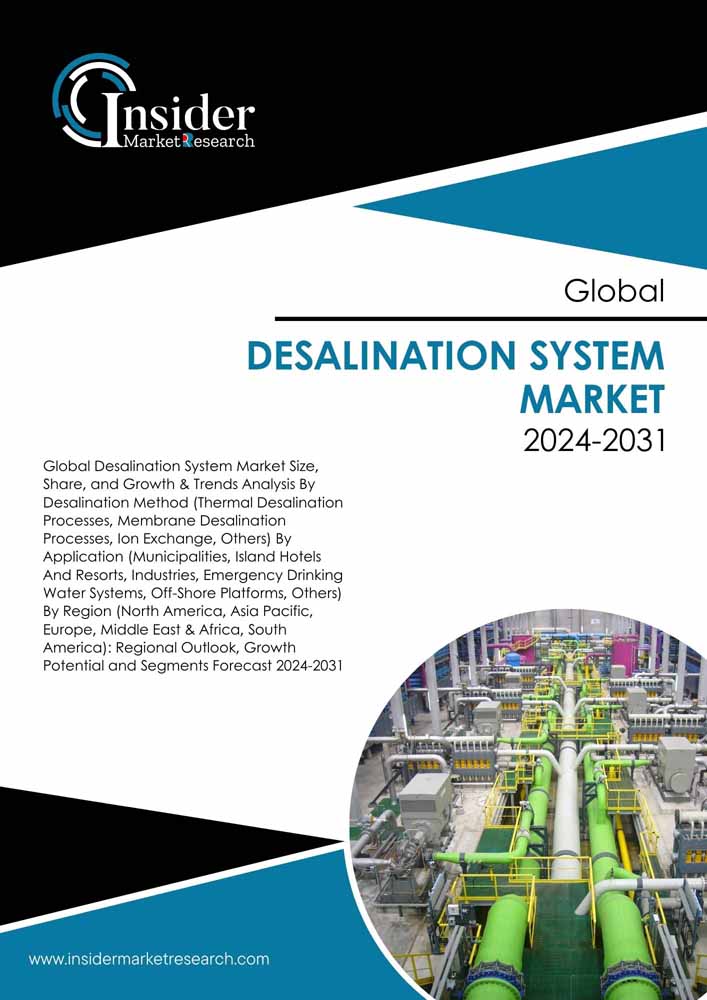
Table of Content

CHAPTER 1: EXECUTIVE SUMMARY
1.1. Summary
CHAPTER 2: RESEARCH METHODOLOGY
2.1. Research Process
2.2. Primary Research
2.3. Secondary Research
2.4. Market Size Estimation
2.5. Research Methodology
2.6. Analyst Tools/Models/Techniques
2.6.1. Notations
2.7. Market Scope & Segmentation
2.8. Currency & Pricing Considered
CHAPTER 3: MARKET TRENDS
3.1. Introduction
3.2. Drivers
3.2.1. Increasing Water Scarcity
3.3. Restraints
3.3.1. High Initial Costs
3.4. Opportunities
3.4.1. Integration with Renewable Energy
3.5. Challenges
3.5.1. Energy Intensity
3.6. Investment Feasibility Analysis
3.7. Latest Trends
CHAPTER 4: MARKET ASSESSMENT
4.1. Porters Five Forces Analysis
4.1.1. Bargaining Power of Suppliers
4.1.2. Bargaining Power of Buyers
4.1.3. Threat of New Entrants
4.1.4. Threat of Substitute
4.1.5. Intensity of Competitive Rivalry
4.2. Value Chain Analysis
4.3. Market Share Analysis
4.4. Impact of Key Regulations on the Market
4.5. SWOT Analysis
4.6. PESTEL Analysis
4.7. Patent Analysis
4.7.1. BY DESALINATION METHOD
4.7.2. BY APPLICATION
4.8. Roadmap Development
4.9. Market Lineage Outlook
4.9.1. Parent Market Outlook
4.9.2. Ancillary Market Outlook
CHAPTER 5: IMPACT OF RECESSION ON THE MARKET
5.1. Introduction
5.1.1. Short Term Impact
5.1.2. Long Term Impact
CHAPTER 6: GLOBAL DESALINATION SYSTEM MARKET, BY DESALINATION METHOD
6.1. Introduction
6.1.1. Market Size & Forecast
6.1.2. Global Desalination System Market Share, By Desalination Method -2023 and 2031 (%)
6.2. THERMAL DESALINATION PROCESSES
6.2.1. Key market Trends, Growth Factors, and Opportunities
6.2.2. Market Size and Forecast, by Regions
6.3. MEMBRANE DESALINATION PROCESSES
6.3.1. Key marke
6.3.2. t Trends, Growth Factors, and Opportunities
6.3.3. Market Size and Forecast, by Regions
6.4. ION EXCHANGE
6.4.1. Key market Trends, Growth Factors, and Opportunities
6.4.2. Market Size and Forecast, by Regions
6.5. OTHERS
6.5.1. Key market Trends, Growth Factors, and Opportunities
6.5.2. Market Size and Forecast, by Regions
CHAPTER 7: GLOBAL DESALINATION SYSTEM MARKET, BY APPLICATION
7.1. Introduction
7.1.1. Market Size & Forecast
7.1.2. Global Desalination System Market Share, By Application -2023 and 2031 (%)
7.2. MUNICIPALITIES
7.2.1. Key market Trends, Growth Factors, and Opportunities
7.2.2. Market Size and Forecast, by Regions
7.3. ISLAND HOTELS AND RESORTS
7.3.1. Key market Trends, Growth Factors, and Opportunities
7.3.2. Market Size and Forecast, by Regions
7.4. INDUSTRIES
7.4.1. Key market Trends, Growth Factors, and Opportunities
7.4.2. Market Size and Forecast, by Regions
7.5. EMERGENCY DRINKING WATER SYSTEMS
7.5.1. Key market Trends, Growth Factors, and Opportunities
7.5.2. Market Size and Forecast, by Regions
7.6. OFF-SHORE PLATFORMS
7.6.1. Key market Trends, Growth Factors, and Opportunities
7.6.2. Market Size and Forecast, by Regions
7.7. OTHERS
7.7.1. Key market Trends, Growth Factors, and Opportunities
7.7.2. Market Size and Forecast, by Regions
CHAPTER 8: NORTH AMERICA MARKET ANALYSIS
8.1. Introduction
8.2. Desalination System Market by Country
8.3. North America Desalination System Market by Country, USD Million 2019-2031
8.3.1. Market Size & Forecast, By Desalination Method
8.3.2. Market Size & Forecast, By Application
8.4. U.S.
8.4.1. Market Size & Forecast, By Desalination Method
8.4.2. Market Size & Forecast, By Application
8.5. Canada
8.5.1. Market Size & Forecast, By Desalination Method
8.5.2. Market Size & Forecast, By Application
CHAPTER 9: EUROPE MARKET ANALYSIS
9.1. Introduction
9.2. Desalination System Market by Country
9.3. Europe Desalination System Market by Country, USD Million 2019-2031
9.3.1. Market Size & Forecast, By Desalination Method
9.3.2. Market Size & Forecast, By Application
9.4. Germany
9.4.1. Market Size & Forecast, By Desalination Method
9.4.2. Market Size & Forecast, By Application
9.5. France
9.5.1. Market Size & Forecast, By Desalination Method
9.5.2. Market Size & Forecast, By Application
9.6. U.K.
9.6.1. Market Size & Forecast, By Desalination Method
9.6.2. Market Size & Forecast, By Application
9.7. Italy
9.7.1. Market Size & Forecast, By Desalination Method
9.7.2. Market Size & Forecast, By Application
9.8. Spain
9.8.1. Market Size & Forecast, By Desalination Method
9.8.2. Market Size & Forecast, By Application
9.9. Benelux
9.9.1. Market Size & Forecast, By Desalination Method
9.9.2. Market Size & Forecast, By Application
9.10. Rest of Europe
9.10.1. Market Size & Forecast, By Desalination Method
9.10.2. Market Size & Forecast, By Application
CHAPTER 10: ASIA-PACIFIC MARKET ANALYSIS
10.1. Introduction
10.2. Desalination System Market by Country
10.3. Asia Pacific Desalination System Market by Country, USD Million 2019-2031
10.3.1. Market Size & Forecast, By Desalination Method
10.3.2. Market Size & Forecast, By Application
10.4. China
10.4.1. Market Size & Forecast, By Desalination Method
10.4.2. Market Size & Forecast, By Application
10.5. India
10.5.1. Market Size & Forecast, By Desalination Method
10.5.2. Market Size & Forecast, By Application
10.6. Japan
10.6.1. Market Size & Forecast, By Desalination Method
10.6.2. Market Size & Forecast, By Application
10.7. Australia
10.7.1. Market Size & Forecast, By Desalination Method
10.7.2. Market Size & Forecast, By Application
10.8. South Korea
10.8.1. Market Size & Forecast, By Desalination Method
10.8.2. Market Size & Forecast, By Application
10.9. Souethest Asia
10.9.1. Market Size & Forecast, By Desalination Method
10.9.2. Market Size & Forecast, By Application
10.10. Rest of Asia Pacific
10.10.1. Market Size & Forecast, By Desalination Method
10.10.2. Market Size & Forecast, By Application
CHAPTER 11: LATIN AMERICA AND THE CARIBBEAN MARKET ANALYSIS
11.1. Introduction
11.2. Desalination System Market by Country
11.3. Latin America Desalination System Market by Country, USD Million 2019-2031
11.3.1. Market Size & Forecast, By Desalination Method
11.3.2. Market Size & Forecast, By Application
11.4. Brazil
11.4.1. Market Size & Forecast, By Desalination Method
11.4.2. Market Size & Forecast, By Application
11.5. Mexico
11.5.1. Market Size & Forecast, By Desalination Method
11.5.2. Market Size & Forecast, By Application
11.6. Rest of Latin America
11.6.1. Market Size & Forecast, By Desalination Method
11.6.2. Market Size & Forecast, By Application
CHAPTER 12: THE MIDDLE EAST AND AFRICA MARKET ANALYSIS
12.1. Introduction
12.2. Desalination System Market by Country
12.3. MEA Desalination System Market by Country, USD Million 2019-2031
12.3.1. Market Size & Forecast, By Desalination Method
12.3.2. Market Size & Forecast, By Application
12.4. South Africa
12.4.1. Market Size & Forecast, By Desalination Method
12.4.2. Market Size & Forecast, By Application
12.5. Saudi Arabia
12.5.1. Market Size & Forecast, By Desalination Method
12.5.2. Market Size & Forecast, By Application
12.6. UAE
12.6.1. Market Size & Forecast, By Desalination Method
12.6.2. Market Size & Forecast, By Application
12.7. Rest of MEA
12.7.1. Market Size & Forecast, By Desalination Method
12.7.2. Market Size & Forecast, By Application
CHAPTER 13: COMPETITIVE LANDSCAPE
13.1. Introduction
13.2. Market Player Positioning, 2022
13.3. Company Evaluation Matrix
13.4. Product Mapping of Top 10 Player
13.5. Market Opportunities and Future Trends
13.6. Competitive Heatmap
13.7. Top Winning Growth Strategies
13.7.1. Major Growth Strategies
13.7.2. Expansion
13.7.3. Merger and Acquisition
13.7.4. Other Developments
CHAPTER 14: COMPANY PROFILES
14.1. VEOLIA ENVIRONMENT
14.1.1. Company Overview
14.1.2. Key Executives
14.1.3. Financial Overview
14.1.4. Business COMPONENTnalysis
14.1.5. Product Portfolio
14.1.6. Key Strategic Developments
14.2. KURITA WATER INDUSTRIES LTD
14.3. TOYOBO CO., LTD
14.4. KOCH INDUSTRIES, INC
14.5. VONTRON MEMBRANE TECHNOLOGY CO LTD
14.6. THE DOW CHEMICAL COMPANY
14.7. TORAY INDUSTRIES, INC.
14.8. NITTO DENKO CORPORATION
14.9. GE CORPORATION
14.10. DUPONT
14.11. OTHERS

Tables & Figures

LIST OF TABLES
Table 1. GLOBAL DESALINATION SYSTEM MARKET INDUSTRY SNAPSHOT, 2022-2031
Table 2. GLOBAL DESALINATION SYSTEM MARKET SHARE, By Desalination Method -2019-2031 (USD MILLION)
Table 3. GLOBAL DESALINATION SYSTEM MARKET THERMAL DESALINATION PROCESSES, BY REGION-2019-2031 (USD MILLION)
Table 4. GLOBAL DESALINATION SYSTEM MARKET MEMBRANE DESALINATION PROCESSES, BY REGION-2019-2031 (USD MILLION)
Table 5. GLOBAL DESALINATION SYSTEM MARKET ION EXCHANGE, BY REGION-2019-2031 (USD MILLION)
Table 6. GLOBAL DESALINATION SYSTEM MARKET OTHERS, BY REGION-2019-2031 (USD MILLION)
Table 7. GLOBAL DESALINATION SYSTEM MARKET SHARE, By Application -2019-2031 (USD MILLION)
Table 8. GLOBAL DESALINATION SYSTEM MARKET MUNICIPALITIES, BY REGION-2019-2031 (USD MILLION)
Table 9. GLOBAL DESALINATION SYSTEM MARKET ISLAND HOTELS AND RESORTS, BY REGION-2019-2031 (USD MILLION)
Table 10. GLOBAL DESALINATION SYSTEM MARKET EMERGENCY DRINKING WATER SYSTEMS, BY REGION-2019-2031 (USD MILLION)
Table 11. GLOBAL DESALINATION SYSTEM MARKET OFF-SHORE PLATFORMS, BY REGION-2019-2031 (USD MILLION)
Table 12. GLOBAL DESALINATION SYSTEM MARKET INDUSTRIES, BY REGION-2019-2031 (USD MILLION)
Table 13. GLOBAL DESALINATION SYSTEM MARKET OTHER, BY REGION-2019-2031 (USD MILLION)
Table 14. GLOBAL DESALINATION SYSTEM MARKET SHARE, REGION -2019-2031 (USD MILLION)
Table 15. GLOBAL DESALINATION SYSTEM MARKET FOR NORTH AMERICA, BY REGION-2019-2031 (USD MILLION)
Table 16. GLOBAL DESALINATION SYSTEM MARKET FOR ASIA PACIFIC BY REGION-2019-2031 (USD MILLION)
Table 17. GLOBAL DESALINATION SYSTEM MARKET FOR EUROPE BY REGION-2019-2031 (USD MILLION)
Table 18. GLOBAL DESALINATION SYSTEM MARKET FOR MIDDLE EAST & AFRICA BY REGION-2019-2031 (USD MILLION)
Table 19. GLOBAL DESALINATION SYSTEM MARKET FOR SOUTH AMERICA BY REGION-2019-2031 (USD MILLION)
Table 20. NORTH AMERICA Desalination System Market BY COUNTRY, USD MILLION 2019-2031
Table 21. NORTH AMERICA Desalination System Market SHARE, By Desalination Method -2019-2031 (USD MILLION)
Table 22. NORTH AMERICA Desalination System Market SHARE, By Application -2019-2031 (USD MILLION)
Table 23. NORTH AMERICA Desalination System Market SHARE, by REGION -2019-2031 (USD MILLION)
Table 24. U.S. Desalination System Market SHARE, By Desalination Method -2019-2031 (USD MILLION)
Table 25. U.S. Desalination System Market SHARE, By Application -2019-2031 (USD MILLION)
Table 26. U.S. Desalination System Market SHARE, by REGION -2019-2031 (USD MILLION)
Table 27. CANADA Desalination System Market SHARE, By Desalination Method -2019-2031 (USD MILLION)
Table 28. CANADA Desalination System Market SHARE, By Application -2019-2031 (USD MILLION)
Table 29. EUROPE Desalination System Market BY COUNTRY, USD MILLION 2019-2031
Table 30. EUROPE Desalination System Market SHARE, By Desalination Method -2019-2031 (USD MILLION)
Table 31. EUROPE Desalination System Market SHARE, By Application -2019-2031 (USD MILLION)
Table 32. GERMANY Desalination System Market SHARE, By Desalination Method -2019-2031 (USD MILLION)
Table 33. GERMANY Desalination System Market SHARE, By Application -2019-2031 (USD MILLION)
Table 34. FRANCE Desalination System Market SHARE, By Desalination Method -2019-2031 (USD MILLION)
Table 35. FRANCE Desalination System Market SHARE, By Application -2019-2031 (USD MILLION)
Table 36. UK Desalination System Market SHARE, By Desalination Method -2019-2031 (USD MILLION)
Table 37. UK Desalination System Market SHARE, By Application -2019-2031 (USD MILLION)
Table 38. ITALY Desalination System Market SHARE, By Desalination Method -2019-2031 (USD MILLION)
Table 39. ITALY Desalination System Market SHARE, By Application -2019-2031 (USD MILLION)
Table 40. SPAIN Desalination System Market SHARE, By Desalination Method -2019-2031 (USD MILLION)
Table 41. SPAIN Desalination System Market SHARE, By Application -2019-2031 (USD MILLION)
Table 42. BENELUX Desalination System Market SHARE, By Desalination Method -2019-2031 (USD MILLION)
Table 43. BENELUX Desalination System Market SHARE, By Application -2019-2031 (USD MILLION)
Table 44. REST OF EUROPE Desalination System Market SHARE, By Desalination Method -2019-2031 (USD MILLION)
Table 45. REST OF EUROPE Desalination System Market SHARE, By Application -2019-2031 (USD MILLION)
Table 46. ASIA PACIFIC Desalination System Market BY COUNTRY, USD MILLION 2019-2031
Table 47. ASIA PACIFIC Desalination System Market SHARE, By Desalination Method -2019-2031 (USD MILLION)
Table 48. ASIA PACIFIC Desalination System Market SHARE, By Application -2019-2031 (USD MILLION)
Table 49. CHINA Desalination System Market SHARE, By Desalination Method -2019-2031 (USD MILLION)
Table 50. CHINA Desalination System Market SHARE, By Application -2019-2031 (USD MILLION)
Table 51. INDIA Desalination System Market SHARE, By Desalination Method -2019-2031 (USD MILLION)
Table 52. INDIA Desalination System Market SHARE, By Application -2019-2031 (USD MILLION)
Table 53. JAPAN Desalination System Market SHARE, By Desalination Method -2019-2031 (USD MILLION)
Table 54. JAPAN Desalination System Market SHARE, By Application -2019-2031 (USD MILLION)
Table 55. AUSTRALIA Desalination System Market SHARE, By Desalination Method -2019-2031 (USD MILLION)
Table 56. AUSTRALIA Desalination System Market SHARE, By Application -2019-2031 (USD MILLION)
Table 57. SOUTH KOREA Desalination System Market SHARE, By Desalination Method -2019-2031 (USD MILLION)
Table 58. SOUTH KOREA Desalination System Market SHARE, By Application -2019-2031 (USD MILLION)
Table 59. SOUETHEST ASIA Desalination System Market SHARE, By Desalination Method -2019-2031 (USD MILLION)
Table 60. SOUETHEST ASIA Desalination System Market SHARE, By Application -2019-2031 (USD MILLION)
Table 61. REST OF ASIA PACIFIC Desalination System Market SHARE, By Desalination Method -2019-2031 (USD MILLION)
Table 62. REST OF ASIA PACIFIC Desalination System Market SHARE, By Application -2019-2031 (USD MILLION)
Table 63. LATIN AMERICA Desalination System Market BY COUNTRY, USD MILLION 2019-2031
Table 64. LATIN AMERICA Desalination System Market SHARE, By Desalination Method -2019-2031 (USD MILLION)
Table 65. LATIN AMERICA Desalination System Market SHARE, By Application -2019-2031 (USD MILLION)
Table 66. BRAZIL Desalination System Market SHARE, By Desalination Method -2019-2031 (USD MILLION)
Table 67. BRAZIL Desalination System Market SHARE, By Application -2019-2031 (USD MILLION)
Table 68. MEXICO Desalination System Market SHARE, By Desalination Method -2019-2031 (USD MILLION)
Table 69. MEXICO Desalination System Market SHARE, By Application -2019-2031 (USD MILLION)
Table 70. REST OF LATIN AMERICA Desalination System Market SHARE, By Desalination Method -2019-2031 (USD MILLION)
Table 71. REST OF LATIN AMERICA Desalination System Market SHARE, By Application -2019-2031 (USD MILLION)
Table 72. MEA Desalination System Market BY COUNTRY, USD MILLION 2019-2031
Table 73. MEA Desalination System Market SHARE, By Desalination Method -2019-2031 (USD MILLION)
Table 74. MEA Desalination System Market SHARE, By Application -2019-2031 (USD MILLION)
Table 75. SOUTH AFRICA Desalination System Market SHARE, By Desalination Method -2019-2031 (USD MILLION)
Table 76. SOUTH AFRICA Desalination System Market SHARE, By Application -2019-2031 (USD MILLION)
Table 77. SAUDI ARABIA Desalination System Market SHARE, By Desalination Method -2019-2031 (USD MILLION)
Table 78. SAUDI ARABIA Desalination System Market SHARE, By Application -2019-2031 (USD MILLION)
Table 79. UAE Desalination System Market SHARE, By Desalination Method -2019-2031 (USD MILLION)
Table 80. UAE Desalination System Market SHARE, By Application -2019-2031 (USD MILLION)
Table 81. REST OF MEA Desalination System Market SHARE, By Desalination Method -2019-2031 (USD MILLION)
Table 82. REST OF MEA Desalination System Market SHARE, By Application -2019-2031 (USD MILLION)
Table 83. KEY EXPANSIONS (2019-2022)
Table 84. KEY MERGERS AND ACQUISITION (2019-2022)
Table 85. OTHER KEY DEVELOPMENTS (2019-2022)

LIST OF FIGURES
Figure 1. REGIONAL ANALYSIS (2022 & 2031)
Figure 2. RESEARCH PROCESS
Figure 3. ANALYSIS FRAMEWORK
Figure 4. IMPACT OF KEY REGULATION ON THE MARKET
Figure 5. SWOT ANALYSIS
Figure 6. GLOBAL DESALINATION SYSTEM MARKET SHARE, By Desalination Method -2023 & 2031 (USD MILLION)
Figure 7. GLOBAL DESALINATION SYSTEM MARKET , THERMAL DESALINATION PROCESSES -2019-2031 (USD MILLION)
Figure 8. GLOBAL DESALINATION SYSTEM MARKET , MEMBRANE DESALINATION PROCESSES -2019-2031 (USD MILLION)
Figure 9. GLOBAL DESALINATION SYSTEM MARKET , ION EXCHANGE -2019-2031 (USD MILLION)
Figure 10. GLOBAL DESALINATION SYSTEM MARKET , OTHERS -2019-2031 (USD MILLION)
Figure 11. GLOBAL DESALINATION SYSTEM MARKET SHARE, By Application -2023 & 2031 (USD MILLION)
Figure 12. GLOBAL DESALINATION SYSTEM MARKET , MUNICIPALITIES -2019-2031 (USD MILLION)
Figure 13. GLOBAL DESALINATION SYSTEM MARKET , ISLAND HOTELS AND RESORTS -2019-2031 (USD MILLION)
Figure 14. GLOBAL DESALINATION SYSTEM MARKET , EMERGENCY DRINKING WATER SYSTEMS -2019-2031 (USD MILLION)
Figure 15. GLOBAL DESALINATION SYSTEM MARKET , OFF-SHORE PLATFORMS -2019-2031 (USD MILLION)
Figure 16. GLOBAL DESALINATION SYSTEM MARKET , OTHERS -2019-2031 (USD MILLION)
Figure 17. MARKET PLAYER POSITIONING, 2022
Figure 18. COMPANY EVALUATION MATRIX
Figure 19. PRODUCT MAPPING OF TOP 10 PLAYERS
Figure 20. COMPETITIVE HEATMAP OF KEY PLAYERS

Frequently Asked Questions (FAQ):

  • Which is the leading segment in the Global Desalination System Market?

    The Membrane Desalination Processes segment, particularly reverse osmosis (RO), dominates the global desalination market.
  • What are the key factors driving the Global Desalination System Market?

    Increasing water scarcity, Innovations in desalination technologies, population growth are some of the key factors driving the growth in the market.
  • Which region will contribute notably towards the Global Desalination System Market?

    North America region to contribute the major share towards the market growth.
  • What are the key players in the Global Desalination System Market?

    Veolia Environment, Kurita Water Industries Ltd, Toyobo Co., Ltd, Koch Industries, Inc, Vontron Membrane Technology Co Ltd, The Dow Chemical Company, Toray Industries, Inc., Nitto Denko Corporation, Ge Corporation, Dupont.

Buying Options

Original price was: $9,999.00.Current price is: $8,999.00.
Original price was: $4,999.00.Current price is: $3,999.00.
Original price was: $3,999.00.Current price is: $2,999.00.