Global Hologram Market Size, Share, and Growth & Trends Analysis By Component (Hardware, Software) By Industry Vertical (Consumer electronics, Retail, Medical, Industrial, Defense) By Region (North America, Asia Pacific, Europe, Middle East & Africa, South America): Regional Outlook, Growth Potential and Segments Forecast 2024-2031

Loading...

Budget constraints? Get in touch with us for special pricing

Buying Options

Original price was: $9,999.00.Current price is: $8,999.00.
Original price was: $4,999.00.Current price is: $3,999.00.
Original price was: $3,999.00.Current price is: $2,999.00.
Loading...

Description

The Global Hologram Market size was USD 3.5 billion in 2023 and is projected to reach USD 20.9 billion by 2031, with a CAGR of 21.49% during the forecast period. 

Global Hologram Market: Overview

Constant advances in holographic projection techniques, the use of augmented reality (AR), and virtual reality (VR) are fuelling the growth of holographic technology as well as applications. Digital holographic displays, driven by modern digital computations, are seeing profitable growth, delivering excellent quality, full-color holographic pictures with amazing clarity and realism. These displays have transformed an array of industries, including health care and automobile design. South Korean researchers are using artificial intelligence (AI) to turn 2D medical imagery into immersive 3D holographic images, eliminating the requirement for specialised glasses and showing AI’s ability to augment holographic technology. The growing use of holographic displays in advertising & events is a key business driver, providing outstanding visual impact and audience participation while enhancing brand awareness. In addition, improvements in screenless displays are driving the holographic display market, opening doors to immersive and interactive visual experiences.

Global Hologram Market: Covid-19 Impact

COVID-19 fuelled a spike in the holographic business as remote cooperation became critical. Holographic technologies enabled immersive virtual events and meetings, reducing physical interaction hazards. Industries such as medicine used holograms for remote diagnostics and videoconferencing. Holographic displays in retail are proving becoming increasingly common for contactless customer engagement. COVID-19 highlighted holograms’ potential to reshape interactions and interaction paradigms, driving global growth.

Global Hologram Market: Growth Drivers

  • Technological Advancements:

Continuous advancements in holographic technology, including improvements in resolution, color accuracy, and size, are driving the growth of the hologram market. As technology evolves, holograms become more lifelike and versatile, expanding their applications across various industries such as entertainment, advertising, and healthcare.

  • Increasing Demand for 3D Visualization:

With the rising demand for immersive and interactive experiences, there is a growing interest in 3D visualization technologies like holograms. Businesses are leveraging holographic displays for product demonstrations, presentations, and marketing campaigns to captivate audiences and enhance engagement.

  • Cost Reduction and Scalability:

As manufacturing methods grow more efficient and economies of scale are realised, the cost for producing holographic displays falls. This cost reduction, paired with industrial scalability, makes holographic technology readily available to a broader variety of organisations and consumers, hence sustaining market growth.

Global Hologram Market: Restraining Factors

  • High Initial Investment:

Despite the decreasing costs, implementing holographic technology still requires a significant initial investment. This can act as a barrier for smaller businesses or organizations with limited budgets, hindering widespread adoption of holographic displays.

  • Content Creation Challenges:

Creating compelling and high-quality holographic content can be complex and time-consuming. Many businesses may struggle with developing content that effectively utilizes the capabilities of holographic displays, thus limiting the adoption of this technology in certain applications.

Global Hologram Market:  Opportunity Factors

  • Augmented Reality Integration:

Integrating holographic technology with augmented reality (AR) presents significant opportunities for innovation. By overlaying holographic elements onto the real world through AR devices like smartphones and smart glasses, businesses can create immersive experiences for consumers, opening up new possibilities in areas such as retail, gaming, and education.

  • Vertical Market Expansion:

Holographic displays have applications across various industries beyond entertainment and advertising. There are opportunities to expand into sectors such as healthcare, automotive, and architecture, where holograms can be utilized for medical imaging, virtual prototyping, and architectural visualization, among other purposes.

Global Hologram Market: Challenges

  • Regulatory Hurdles:

The hologram market may face regulatory challenges related to privacy, safety, and intellectual property rights. Governments and regulatory bodies may impose restrictions or standards for holographic technology, requiring manufacturers and businesses to comply with additional regulations, which could impact market growth and innovation.

  • Limited Display Size and Viewing Angles:

Current holographic displays often have limitations in terms of display size and viewing angles. Achieving large-scale holographic projections or maintaining image quality across different viewing perspectives can be technically challenging. Overcoming these limitations while maintaining cost-effectiveness remains a significant challenge for the hologram market.

Global Hologram Market: Segmentation

Based on Component: The market is segmented into Hardware & Software.

Based on Industry Vertical: The market is segmented into Consumer electronics, Retail, Medical, Industrial, Defense.

Global Hologram Market: Regional Insights

  • North America:

Holographic technology is changing multiple industries in North America. In healthcare, it enables enhanced treatment and study by illustrating interior organs in 3D, which improves medical the practitioners’ comprehension of patient situations. The popularity of 3D gaming is increasing the need for holographic displays in smartphones, which offer transportable gaming experiences. Augmented reality (AR) and holographic displays are coming together to create complete immersion in the entertainment, healthcare, and retail sectors. These developments show the versatility and rapid adoption of holographic technology across North America, from enhancing medical diagnostics to revolutionising the user experience in gaming and other sectors, resulting in an important move in various sectors towards more immersive and interactive solutions.

  • Asia Pacific:

The Asia Pacific hologram market is expanding quickly, owing to advances in holographic technologies and growing usage across a wide range of sectors. Holograms are becoming increasingly important for improving consumer experiences and delivering immersive content in an array of applications, including advertising, entertainment, security, and healthcare. Rapid urbanisation, combined with rising disposable incomes in China, India, and Japan, has driven up demand for hologram displays in retail, events, and exhibitions. In addition, government activities to combat counterfeiting and improve security are driving the development of photorealistic technologies for validation and brand protection.

Global Hologram Market: Competitive Landscape

Holoxica Limited, HYPERVSN, Leia Inc., Holotech Switzerland AG, REALFICTION, SeeReal Technologies S.A., EON Reality Inc., RealView Imaging, Looking Glass, Qualcomm Technologies, Inc.

Global Hologram Market: Recent Developments

  • June 10, 2024 – EON Reality, a pioneer in immersive learning technologies, proudly announces a ground breaking educational initiative in Timor-Leste. This project introduces the nation’s first Spatial AI Centre and the EON AI Autonomous Agents, set to revolutionize the educational experience for Timorese students and professionals.
  • June 7, 2024In a significant development poised to transform education in Tuvalu, EON Reality, a global leader in virtual and augmented reality (VR and AR) for education and industry, is excited to announce the national launch of Tuvalu’s first Spatial AI Center.

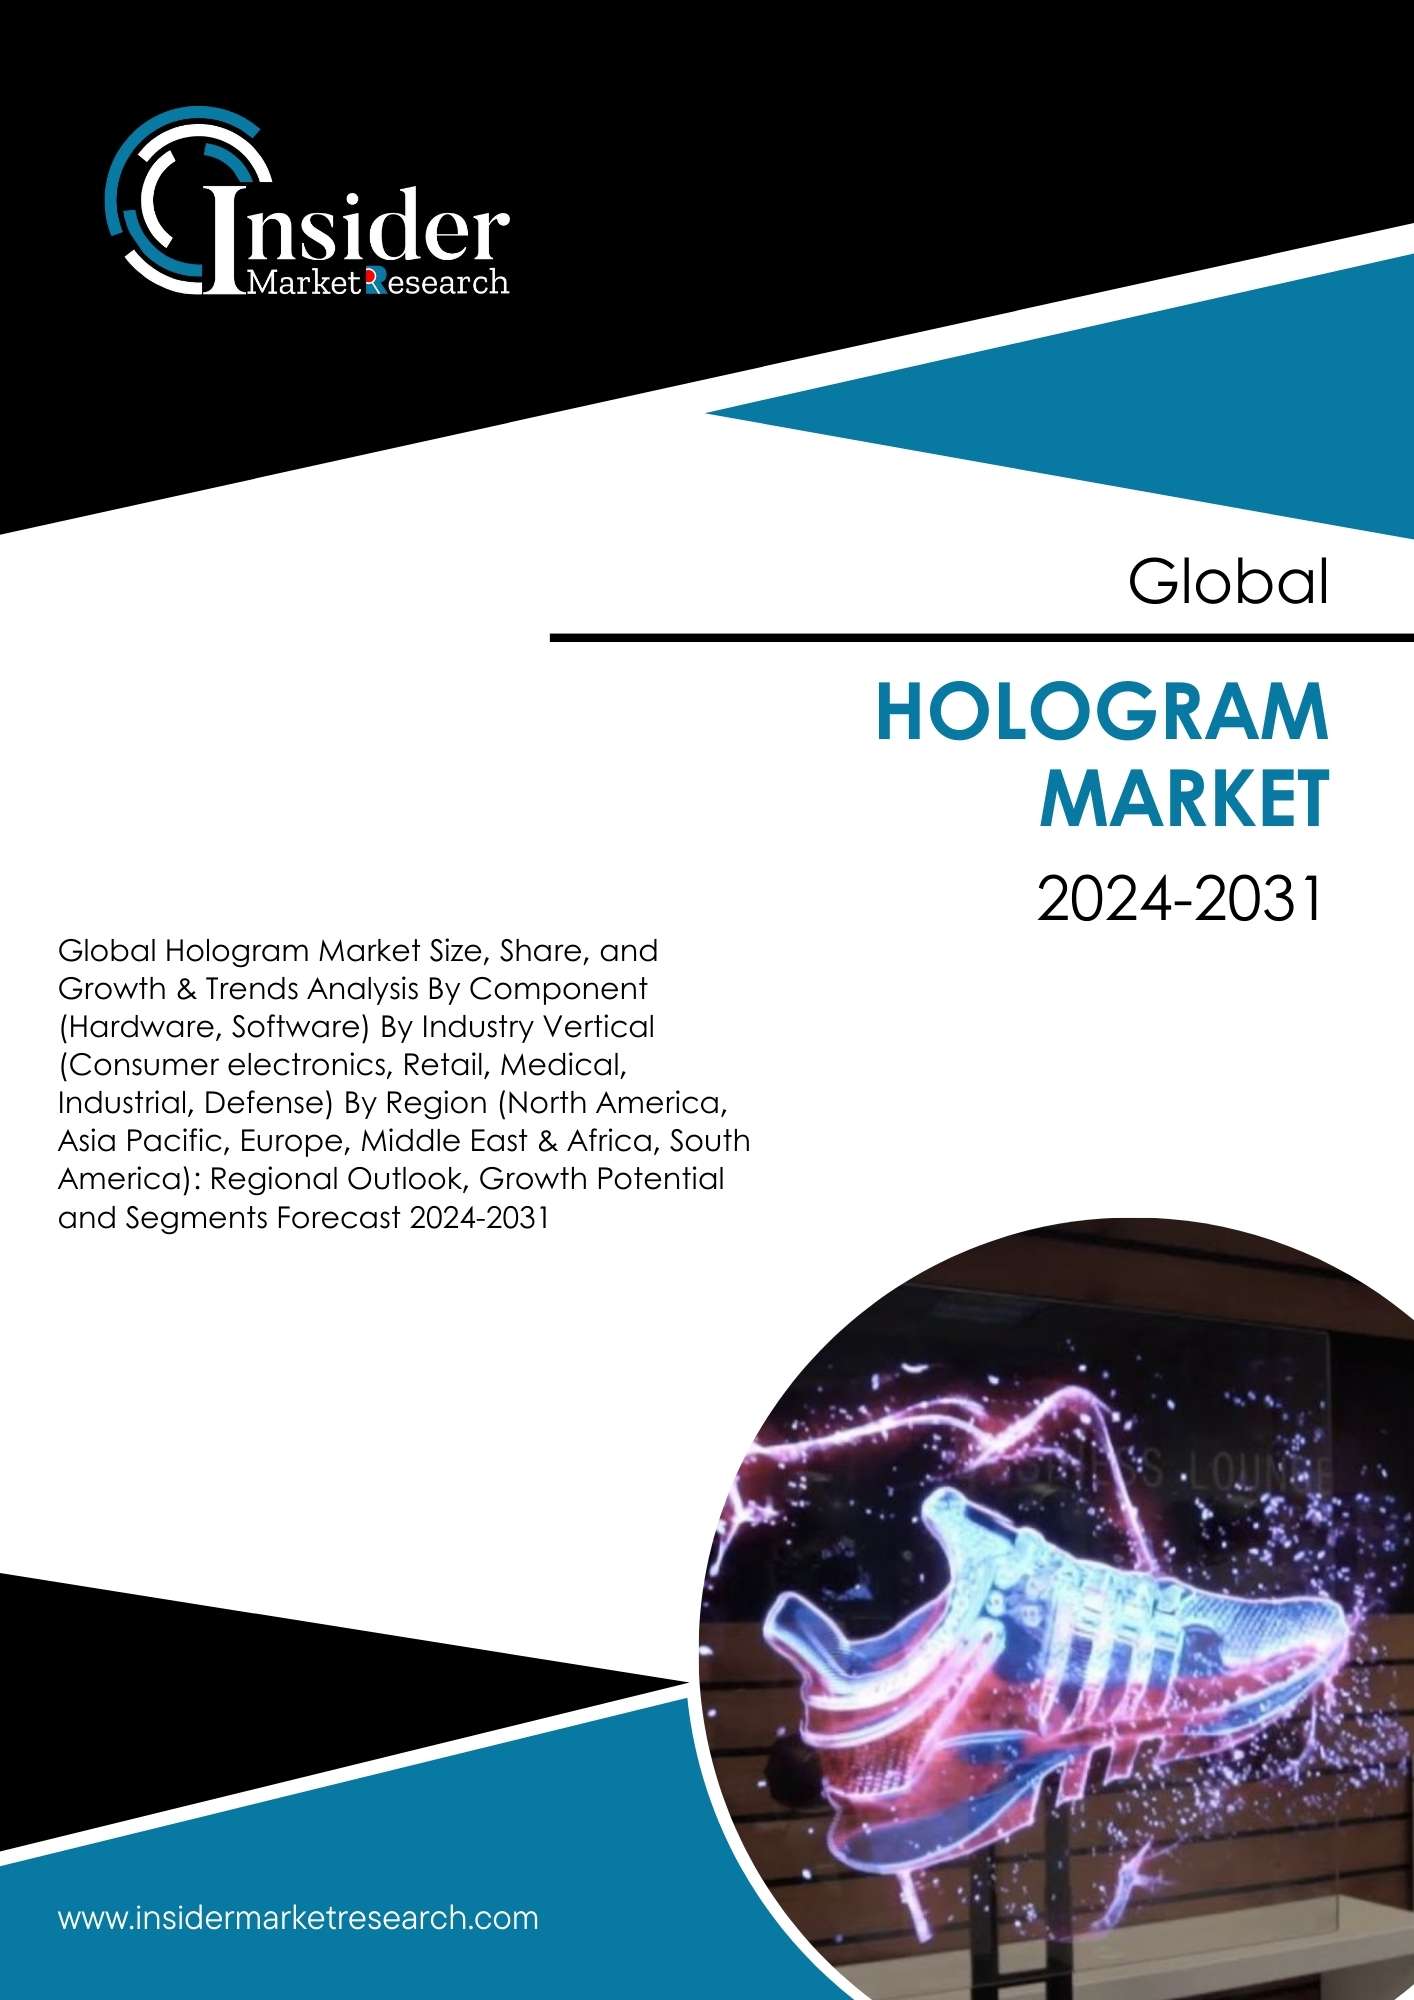
Table of Content

CHAPTER 1: EXECUTIVE SUMMARY
1.1. Summary
CHAPTER 2: RESEARCH METHODOLOGY
2.1. Research Process
2.2. Primary Research
2.3. Secondary Research
2.4. Market Size Estimation
2.5. Research Methodology
2.6. Analyst Tools/Models/Techniques
2.6.1. Notations
2.7. Market Scope & Segmentation
2.8. Currency & Pricing Considered
CHAPTER 3: MARKET TRENDS
3.1. Introduction
3.2. Drivers
3.2.1. Increasing Demand for 3D Visualization
3.3. Restraints
3.3.1. High Initial Investment
3.4. Opportunities
3.4.1. Augmented Reality Integration
3.5. Challenges
3.5.1. Limited Display Size and Viewing Angles
3.6. Investment Feasibility Analysis
3.7. Latest Trends
CHAPTER 4: MARKET ASSESSMENT
4.1. Porters Five Forces Analysis
4.1.1. Bargaining Power of Suppliers
4.1.2. Bargaining Power of Buyers
4.1.3. Threat of New Entrants
4.1.4. Threat of Substitute
4.1.5. Intensity of Competitive Rivalry
4.2. Value Chain Analysis
4.3. Market Share Analysis
4.4. Impact of Key Regulations on the Market
4.5. SWOT Analysis
4.6. PESTEL Analysis
4.7. Patent Analysis
4.7.1. By COMPONENT
4.7.2. By INDUSTRY VERTICAL
4.8. Roadmap Development
4.9. Market Lineage Outlook
4.9.1. Parent Market Outlook
4.9.2. Ancillary Market Outlook
CHAPTER 5: IMPACT OF RECESSION ON THE MARKET
5.1. Introduction
5.1.1. Short Term Impact
5.1.2. Long Term Impact
CHAPTER 6: GLOBAL HOLOGRAM MARKET, BY COMPONENT
6.1. Introduction
6.1.1. Market Size & Forecast
6.1.2. GLOBAL HOLOGRAM MARKET Share, by Component -2023 and 2031 (%)
6.2. HARDWARE
6.2.1. Key market Trends, Growth Factors, and Opportunities
6.2.2. Market Size and Forecast, by Regions
6.3. SOFTWARE
6.3.1. Key market Trends, Growth Factors, and Opportunities
6.3.2. Market Size and Forecast, by Regions
CHAPTER 7: GLOBAL HOLOGRAM MARKET, BY INDUSTRY VERTICAL
7.1. Introduction
7.1.1. Market Size & Forecast
7.1.2. GLOBAL HOLOGRAM MARKET Share, INDUSTRY VERTICAL -2023 and 2031 (%)
7.2. CONSUMER ELECTRONICS
7.2.1. Key market Trends, Growth Factors, and Opportunities
7.2.2. Market Size and Forecast, by Regions
7.3. RETAIL
7.3.1. Key market Trends, Growth Factors, and Opportunities
7.3.2. Market Size and Forecast, by Regions
7.4. MEDICAL
7.4.1. Key market Trends, Growth Factors, and Opportunities
7.4.2. Market Size and Forecast, by Regions
7.5. INDUSTRIAL
7.5.1. Key market Trends, Growth Factors, and Opportunities
7.5.2. Market Size and Forecast, by Regions
7.6. DEFENSE
7.6.1. Key market Trends, Growth Factors, and Opportunities
7.6.2. Market Size and Forecast, by Regions
CHAPTER 8: NORTH AMERICA MARKET ANALYSIS
8.1. Introduction
8.2. HOLOGRAM Market by Country
8.3. North America HOLOGRAM Market by Country, USD Million 2019-2031
8.3.1. Market Size & Forecast, By COMPONENT
8.3.2. Market Size & Forecast, by INDUSTRY VERTICAL
8.4. U.S.
8.4.1. Market Size & Forecast, By COMPONENT
8.4.2. Market Size & Forecast, by INDUSTRY VERTICAL
8.5. Canada
8.5.1. Market Size & Forecast, By COMPONENT
8.5.2. Market Size & Forecast, by INDUSTRY VERTICAL
CHAPTER 9: EUROPE MARKET ANALYSIS
9.1. Introduction
9.2. HOLOGRAM Market by Country
9.3. Europe HOLOGRAM Market by Country, USD Million 2019-2031
9.3.1. Market Size & Forecast, By COMPONENT
9.3.2. Market Size & Forecast, by INDUSTRY VERTICAL
9.4. Germany
9.4.1. Market Size & Forecast, By COMPONENT
9.4.2. Market Size & Forecast, by INDUSTRY VERTICAL
9.5. France
9.5.1. Market Size & Forecast, By COMPONENT
9.5.2. Market Size & Forecast, by INDUSTRY VERTICAL
9.6. U.K.
9.6.1. Market Size & Forecast, By COMPONENT
9.6.2. Market Size & Forecast, by INDUSTRY VERTICAL
9.7. Italy
9.7.1. Market Size & Forecast, By COMPONENT
9.7.2. Market Size & Forecast, by INDUSTRY VERTICAL
9.8. Spain
9.8.1. Market Size & Forecast, By COMPONENT
9.8.2. Market Size & Forecast, by INDUSTRY VERTICAL
9.9. Benelux
9.9.1. Market Size & Forecast, By COMPONENT
9.9.2. Market Size & Forecast, by INDUSTRY VERTICAL
9.10. Rest of Europe
9.10.1. Market Size & Forecast, By COMPONENT
9.10.2. Market Size & Forecast, by INDUSTRY VERTICAL
CHAPTER 10: ASIA-PACIFIC MARKET ANALYSIS
10.1. Introduction
10.2. HOLOGRAM Market by Country
10.3. Asia Pacific HOLOGRAM Market by Country, USD Million 2019-2031
10.3.1. Market Size & Forecast, By COMPONENT
10.3.2. Market Size & Forecast, by INDUSTRY VERTICAL
10.4. China
10.4.1. Market Size & Forecast, By COMPONENT
10.4.2. Market Size & Forecast, by INDUSTRY VERTICAL
10.5. India
10.5.1. Market Size & Forecast, By COMPONENT
10.5.2. Market Size & Forecast, by INDUSTRY VERTICAL
10.6. Japan
10.6.1. Market Size & Forecast, By COMPONENT
10.6.2. Market Size & Forecast, by INDUSTRY VERTICAL
10.7. Australia
10.7.1. Market Size & Forecast, By COMPONENT
10.7.2. Market Size & Forecast, by INDUSTRY VERTICAL
10.8. South Korea
10.8.1. Market Size & Forecast, By COMPONENT
10.8.2. Market Size & Forecast, by INDUSTRY VERTICAL
10.9. Souethest Asia
10.9.1. Market Size & Forecast, By COMPONENT
10.9.2. Market Size & Forecast, by INDUSTRY VERTICAL
10.10. Rest of Asia Pacific
10.10.1. Market Size & Forecast, By COMPONENT
10.10.2. Market Size & Forecast, by INDUSTRY VERTICAL
CHAPTER 11: LATIN AMERICA AND THE CARIBBEAN MARKET ANALYSIS
11.1. Introduction
11.2. HOLOGRAM Market by Country
11.3. Latin America HOLOGRAM Market by Country, USD Million 2019-2031
11.3.1. Market Size & Forecast, By COMPONENT
11.3.2. Market Size & Forecast, by INDUSTRY VERTICAL
11.4. Brazil
11.4.1. Market Size & Forecast, By COMPONENT
11.4.2. Market Size & Forecast, by INDUSTRY VERTICAL
11.5. Mexico
11.5.1. Market Size & Forecast, By COMPONENT
11.5.2. Market Size & Forecast, by INDUSTRY VERTICAL
11.6. Rest of Latin America
11.6.1. Market Size & Forecast, By COMPONENT
11.6.2. Market Size & Forecast, by INDUSTRY VERTICAL
CHAPTER 12: THE MIDDLE EAST AND AFRICA MARKET ANALYSIS
12.1. Introduction
12.2. Hologram Market by Country
12.3. MEA Hologram Market by Country, USD Million 2019-2031
12.3.1. Market Size & Forecast, By COMPONENT
12.3.2. Market Size & Forecast, by INDUSTRY VERTICAL
12.4. South Africa
12.4.1. Market Size & Forecast, By COMPONENT
12.4.2. Market Size & Forecast, by INDUSTRY VERTICAL
12.5. Saudi Arabia
12.5.1. Market Size & Forecast, By COMPONENT
12.5.2. Market Size & Forecast, by INDUSTRY VERTICAL
12.6. UAE
12.6.1. Market Size & Forecast, By COMPONENT
12.6.2. Market Size & Forecast, by INDUSTRY VERTICAL
12.7. Rest of MEA
12.7.1. Market Size & Forecast, By COMPONENT
12.7.2. Market Size & Forecast, by INDUSTRY VERTICAL
CHAPTER 13: COMPETITIVE LANDSCAPE
13.1. Introduction
13.2. Market Player Positioning, 2022
13.3. Company Evaluation Matrix
13.4. Product Mapping of Top 10 Player
13.5. Market Opportunities and Future Trends
13.6. Competitive Heatmap
13.7. Top Winning Growth Strategies
13.7.1. Major Growth Strategies
13.7.2. Expansion
13.7.3. Merger and Acquisition
13.7.4. Other Developments
CHAPTER 14: COMPANY PROFILES
14.1. HOLOXICA LIMITED
14.1.1. Company Overview
14.1.2. Key Executives
14.1.3. Financial Overview
14.1.4. Business Componentnalysis
14.1.5. Product Portfolio
14.1.6. Key Strategic Developments
14.2. HYPERVSN
14.3. LEIA INC.
14.4. HOLOTECH SWITZERLAND AG
14.5. REALFICTION
14.6. SEEREAL TECHNOLOGIES S.A.
14.7. EON REALITY INC.
14.8. REALVIEW IMAGING
14.9. LOOKING GLASS
14.10. QUALCOMM TECHNOLOGIES, INC
14.11. OTHERS

Tables & Figures

LIST OF TABLES
Table 1. GLOBAL HOLOGRAM MARKET INDUSTRY SNAPSHOT, 2022-2031
Table 2. GLOBAL HOLOGRAM MARKET SHARE, by COMPONENT -2019-2031 (USD MILLION)
Table 3. GLOBAL HOLOGRAM MARKET HARDWARE, BY REGION-2019-2031 (USD MILLION)
Table 4. GLOBAL HOLOGRAM MARKET SOFTWARE, BY REGION-2019-2031 (USD MILLION)
Table 5. GLOBAL HOLOGRAM MARKET SHARE, by INDUSTRY VERTICAL SIZE-2019-2031 (USD MILLION)
Table 6. GLOBAL HOLOGRAM MARKET CONSUMER ELECTRONICS, BY REGION-2019-2031 (USD MILLION)
Table 7. GLOBAL HOLOGRAM MARKET RETAIL, BY REGION-2019-2031 (USD MILLION)
Table 8. GLOBAL HOLOGRAM MARKET MEDICAL, BY REGION-2019-2031 (USD MILLION)
Table 9. GLOBAL HOLOGRAM MARKET INDUSTRIAL, BY REGION-2019-2031 (USD MILLION)
Table 10. GLOBAL HOLOGRAM MARKET DEFENSE, BY REGION-2019-2031 (USD MILLION)
Table 11. GLOBAL HOLOGRAM MARKET SHARE, by REGION -2019-2031 (USD MILLION)
Table 12. GLOBAL HOLOGRAM MARKET NORTH AMERICA, BY REGION-2019-2031 (USD MILLION)
Table 13. GLOBAL HOLOGRAM MARKET ASIA PACIFIC, BY REGION-2019-2031 (USD MILLION)
Table 14. GLOBAL HOLOGRAM MARKET EUROPE, BY REGION-2019-2031 (USD MILLION)
Table 15. GLOBAL HOLOGRAM MARKET MIDDLE EAST & AFRICA, BY REGION-2019-2031 (USD MILLION)
Table 16. NORTH AMERICA HOLOGRAM Market BY COUNTRY, USD MILLION 2019-2031
Table 17. NORTH AMERICA HOLOGRAM Market SHARE, by COMPONENT -2019-2031 (USD MILLION)
Table 18. NORTH AMERICA HOLOGRAM Market SHARE, by INDUSTRY VERTICAL -2019-2031 (USD MILLION)
Table 19. U.S. HOLOGRAM Market SHARE, by COMPONENT -2019-2031 (USD MILLION)
Table 20. U.S. HOLOGRAM Market SHARE, by INDUSTRY VERTICAL -2019-2031 (USD MILLION)
Table 21. CANADA HOLOGRAM Market SHARE, by COMPONENT -2019-2031 (USD MILLION)
Table 22. CANADA HOLOGRAM Market SHARE, by INDUSTRY VERTICAL -2019-2031 (USD MILLION)
Table 23. EUROPE HOLOGRAM Market BY COUNTRY, USD MILLION 2019-2031
Table 24. EUROPE HOLOGRAM Market SHARE, by COMPONENT -2019-2031 (USD MILLION)
Table 25. EUROPE HOLOGRAM Market SHARE, by INDUSTRY VERTICAL -2019-2031 (USD MILLION)
Table 26. GERMANY HOLOGRAM Market SHARE, by COMPONENT -2019-2031 (USD MILLION)
Table 27. GERMANY HOLOGRAM Market SHARE, by INDUSTRY VERTICAL -2019-2031 (USD MILLION)
Table 28. FRANCE HOLOGRAM Market SHARE, by COMPONENT -2019-2031 (USD MILLION)
Table 29. FRANCE HOLOGRAM Market SHARE, by INDUSTRY VERTICAL -2019-2031 (USD MILLION)
Table 30. UK HOLOGRAM Market SHARE, by COMPONENT -2019-2031 (USD MILLION)
Table 31. UK HOLOGRAM Market SHARE, by INDUSTRY VERTICAL -2019-2031 (USD MILLION)
Table 32. ITALY HOLOGRAM Market SHARE, by COMPONENT -2019-2031 (USD MILLION)
Table 33. ITALY HOLOGRAM Market SHARE, by INDUSTRY VERTICAL -2019-2031 (USD MILLION)
Table 34. SPAIN HOLOGRAM Market SHARE, by COMPONENT -2019-2031 (USD MILLION)
Table 35. SPAIN HOLOGRAM Market SHARE, by INDUSTRY VERTICAL -2019-2031 (USD MILLION)
Table 36. BENELUX HOLOGRAM Market SHARE, by COMPONENT -2019-2031 (USD MILLION)
Table 37. BENELUX HOLOGRAM Market SHARE, by INDUSTRY VERTICAL -2019-2031 (USD MILLION)
Table 38. REST OF EUROPE HOLOGRAM Market SHARE, by COMPONENT -2019-2031 (USD MILLION)
Table 39. REST OF EUROPE HOLOGRAM Market SHARE, by INDUSTRY VERTICAL -2019-2031 (USD MILLION)
Table 40. ASIA PACIFIC HOLOGRAM Market BY COUNTRY, USD MILLION 2019-2031
Table 41. ASIA PACIFIC HOLOGRAM Market SHARE, by COMPONENT -2019-2031 (USD MILLION)
Table 42. ASIA PACIFIC HOLOGRAM Market SHARE, by INDUSTRY VERTICAL -2019-2031 (USD MILLION)
Table 43. CHINA HOLOGRAM Market SHARE, by COMPONENT -2019-2031 (USD MILLION)
Table 44. CHINA HOLOGRAM Market SHARE, by INDUSTRY VERTICAL -2019-2031 (USD MILLION)
Table 45. INDIA HOLOGRAM Market SHARE, by COMPONENT -2019-2031 (USD MILLION)
Table 46. INDIA HOLOGRAM Market SHARE, by INDUSTRY VERTICAL -2019-2031 (USD MILLION)
Table 47. JAPAN HOLOGRAM Market SHARE, by COMPONENT -2019-2031 (USD MILLION)
Table 48. JAPAN HOLOGRAM Market SHARE, by INDUSTRY VERTICAL -2019-2031 (USD MILLION)
Table 49. AUSTRALIA HOLOGRAM Market SHARE, by COMPONENT -2019-2031 (USD MILLION)
Table 50. AUSTRALIA HOLOGRAM Market SHARE, by INDUSTRY VERTICAL -2019-2031 (USD MILLION)
Table 51. SOUTH KOREA HOLOGRAM Market SHARE, by COMPONENT -2019-2031 (USD MILLION)
Table 52. SOUTH KOREA HOLOGRAM Market SHARE, by INDUSTRY VERTICAL -2019-2031 (USD MILLION)
Table 53. SOUETHEST ASIA HOLOGRAM Market SHARE, by COMPONENT -2019-2031 (USD MILLION)
Table 54. SOUETHEST ASIA HOLOGRAM Market SHARE, by INDUSTRY VERTICAL -2019-2031 (USD MILLION)
Table 55. REST OF ASIA PACIFIC HOLOGRAM Market SHARE, by COMPONENT -2019-2031 (USD MILLION)
Table 56. REST OF ASIA PACIFIC HOLOGRAM Market SHARE, by INDUSTRY VERTICAL -2019-2031 (USD MILLION)
Table 57. LATIN AMERICA HOLOGRAM Market BY COUNTRY, USD MILLION 2019-2031
Table 58. LATIN AMERICA HOLOGRAM Market SHARE, by COMPONENT -2019-2031 (USD MILLION)
Table 59. LATIN AMERICA HOLOGRAM Market SHARE, by INDUSTRY VERTICAL -2019-2031 (USD MILLION)
Table 60. BRAZIL HOLOGRAM Market SHARE, by COMPONENT -2019-2031 (USD MILLION)
Table 61. BRAZIL HOLOGRAM Market SHARE, by INDUSTRY VERTICAL -2019-2031 (USD MILLION)
Table 62. MEXICO HOLOGRAM Market SHARE, by COMPONENT -2019-2031 (USD MILLION)
Table 63. MEXICO HOLOGRAM Market SHARE, by INDUSTRY VERTICAL -2019-2031 (USD MILLION)
Table 64. REST OF LATIN AMERICA HOLOGRAM Market SHARE, by COMPONENT -2019-2031 (USD MILLION)
Table 65. REST OF LATIN AMERICA HOLOGRAM Market SHARE, by INDUSTRY VERTICAL -2019-2031 (USD MILLION)
Table 66. MEA HOLOGRAM Market BY COUNTRY, USD MILLION 2019-2031
Table 67. MEA HOLOGRAM Market SHARE, by COMPONENT -2019-2031 (USD MILLION)
Table 68. MEA HOLOGRAM Market SHARE, by INDUSTRY VERTICAL -2019-2031 (USD MILLION)
Table 69. SOUTH AFRICA HOLOGRAM Market SHARE, by COMPONENT -2019-2031 (USD MILLION)
Table 70. SOUTH AFRICA HOLOGRAM Market SHARE, by INDUSTRY VERTICAL -2019-2031 (USD MILLION)
Table 71. SAUDI ARABIA HOLOGRAM Market SHARE, by COMPONENT -2019-2031 (USD MILLION)
Table 72. SAUDI ARABIA HOLOGRAM Market SHARE, by INDUSTRY VERTICAL -2019-2031 (USD MILLION)
Table 73. UAE HOLOGRAM Market SHARE, by COMPONENT -2019-2031 (USD MILLION)
Table 74. UAE HOLOGRAM Market SHARE, by INDUSTRY VERTICAL -2019-2031 (USD MILLION)
Table 75. REST OF MEA HOLOGRAM Market SHARE, by COMPONENT -2019-2031 (USD MILLION)
Table 76. REST OF MEA HOLOGRAM Market SHARE, by INDUSTRY VERTICAL -2019-2031 (USD MILLION)
Table 77. KEY EXPANSIONS (2019-2022)
Table 78. KEY MERGERS AND ACQUISITION (2019-2022)
Table 79. OTHER KEY DEVELOPMENTS (2019-2022)

LIST OF FIGURES
Figure 1. REGIONAL ANALYSIS (2022 & 2031)
Figure 2. RESEARCH PROCESS
Figure 3. ANALYSIS FRAMEWORK
Figure 4. IMPACT OF KEY REGULATION ON THE MARKET
Figure 5. SWOT ANALYSIS
Figure 6. GLOBAL HOLOGRAM MARKET SHARE, by COMPONENT -2023 & 2031 (USD MILLION)
Figure 7. GLOBAL HOLOGRAM MARKET , HARDWARE -2019-2031 (USD MILLION)
Figure 8. GLOBAL HOLOGRAM MARKET , SOFTWARE -2019-2031 (USD MILLION)
Figure 9. GLOBAL HOLOGRAM MARKET SHARE, by INDUSTRY VERTICAL -2023 & 2031 (USD MILLION)
Figure 10. GLOBAL HOLOGRAM MARKET , CONSUMER ELECTRONICS -2019-2031 (USD MILLION)
Figure 11. GLOBAL HOLOGRAM MARKET , RETAIL -2019-2031 (USD MILLION)
Figure 12. GLOBAL HOLOGRAM MARKET , MEDICAL -2019-2031 (USD MILLION)
Figure 13. GLOBAL HOLOGRAM MARKET , INDUSTRIAL -2019-2031 (USD MILLION)
Figure 14. GLOBAL HOLOGRAM MARKET , DEFENSE -2019-2031 (USD MILLION)
Figure 15. GLOBAL HOLOGRAM MARKET SHARE, by REGION -2023 & 2031 (USD MILLION)
Figure 16. GLOBAL HOLOGRAM MARKET , NORTH AMERICA -2019-2031 (USD MILLION)
Figure 17. GLOBAL HOLOGRAM MARKET , ASIA PACIFIC -2019-2031 (USD MILLION)
Figure 18. GLOBAL HOLOGRAM MARKET , EUROPE -2019-2031 (USD MILLION)
Figure 19. GLOBAL HOLOGRAM MARKET , MIDDLE EAST & AFRICA -2019-2031 (USD MILLION)
Figure 20. GLOBAL HOLOGRAM MARKET , SOUTH AMERICA -2019-2031 (USD MILLION)
Figure 21. MARKET PLAYER POSITIONING, 2022
Figure 22. COMPANY EVALUATION MATRIX
Figure 23. PRODUCT MAPPING OF TOP 10 PLAYERS
Figure 24. COMPETITIVE HEATMAP OF KEY PLAYERS

Frequently Asked Questions (FAQ):

  • Which is the leading segment in the Global Hologram Market?

    Based on Type, Mobile cranes can be easily transported and used for a wide range of applications across various industries, including construction, manufacturing, and logistics.
  • What are the key factors driving the Global Hologram Market?

    Increasing Demand in Healthcare, Technological Advancements, Consumer Electronics Integration are some of the key factors driving the growth in the market.
  • Which region will contribute notably towards the Global Hologram Market?

    North America region to contribute the major share towards the market growth.
  • What are the key players in the Global Hologram Market?

    Holoxica Limited, HYPERVSN, Leia Inc., Holotech Switzerland AG, REALFICTION, SeeReal Technologies S.A., EON Reality Inc., RealView Imaging, Looking Glass, Qualcomm Technologies, Inc and Others.

Buying Options

Original price was: $9,999.00.Current price is: $8,999.00.
Original price was: $4,999.00.Current price is: $3,999.00.
Original price was: $3,999.00.Current price is: $2,999.00.